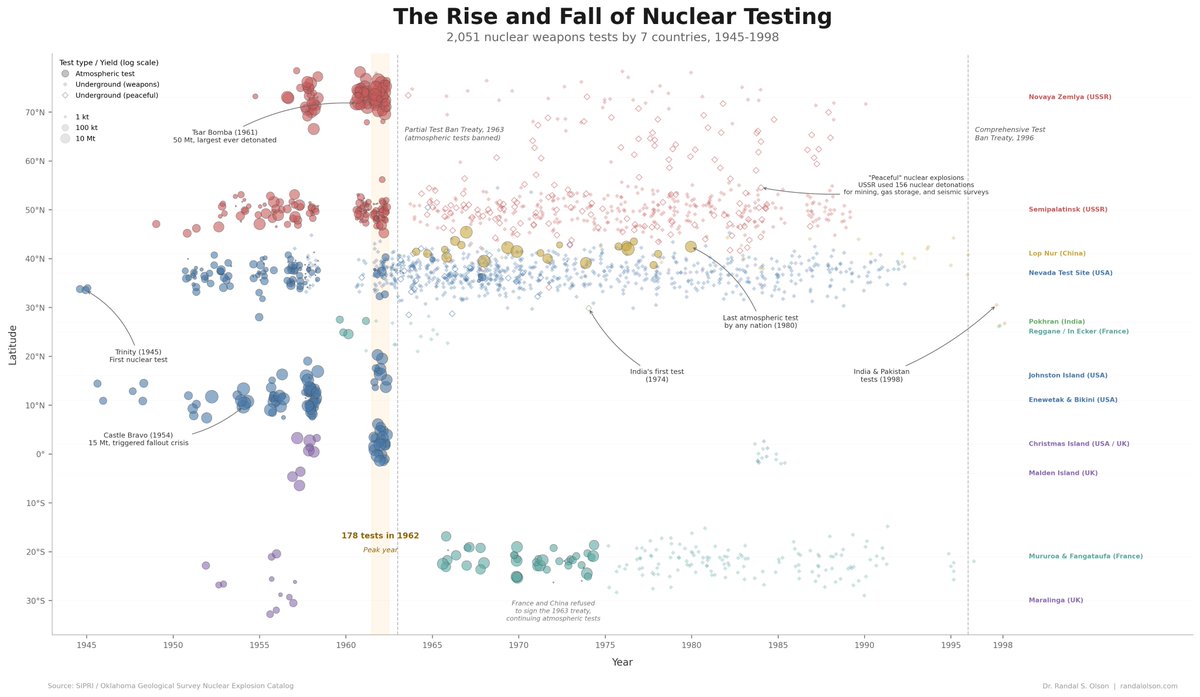
This is bonkers. I challenged my dataviz agent to research & create a compelling dataviz story that effectively displays as many data axes as possible and it created this. So many fascinating stories folded into one chart. Article + full dataviz: randalolson.com/2026/03/27/t…
→ View original post on X — @randal_olson, 2026-03-27 23:44 UTC
Leave a Reply