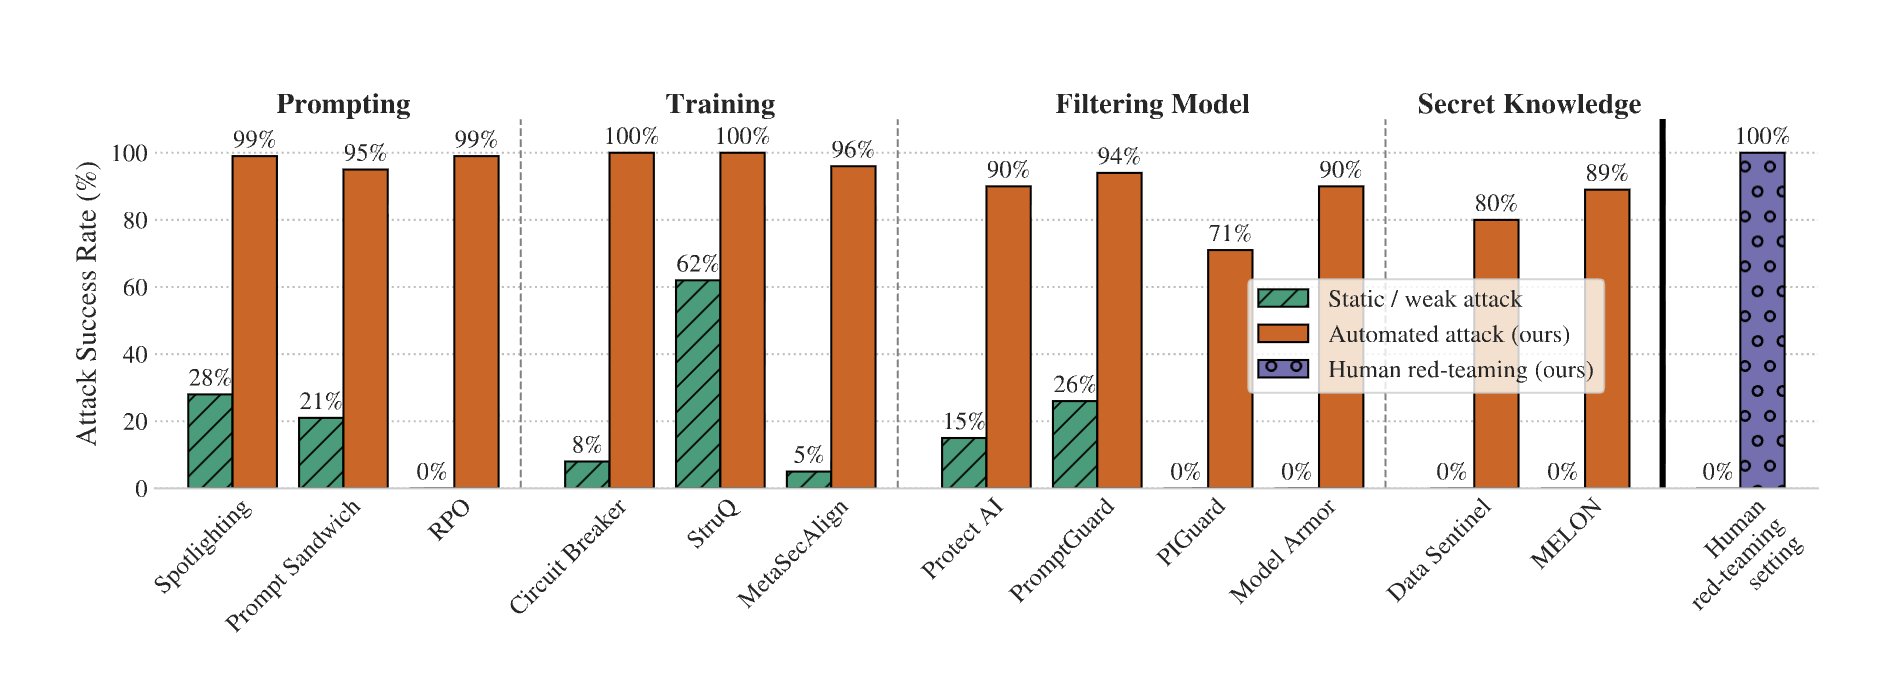
Here's the chart that destroys the illusion. Orange bars = what the defense papers claimed (near 0% attack success)
Blue bars = reality when actual attackers showed up (90%+ broken)
12 defenses across 4 categories. Not a single one survived. The gap between "lab results" and
Defense papers claim 0% success, reality 90% broken
By
–